
Narrowing at the Highs: The Rotation, Eleven Weeks On

In July we measured the lowest sector correlation since 2000 and laid out, from 27 years of data, the signs that separate a healthy rotation from a market top. Eleven weeks later, neither tripwire has fired. Two things we described as quiet in July are no longer quiet.
In A Violent Rotation In A Quiet Market we described an index that looked calm while its insides churned. The nine major sector ETFs were moving together less than at almost any point since 1999, and enormous single-stock moves were cancelling each other out at the index level. History said two things at once. Most episodes like it resolved with the trend intact. Both generational tops of the era, August 2000 and November 2021, launched from exactly this configuration. We closed by saying the data would show which kind of rotation this was before any opinion did.
The data has had eleven weeks to speak. Here is what it shows.
The correlation floor, then the lift
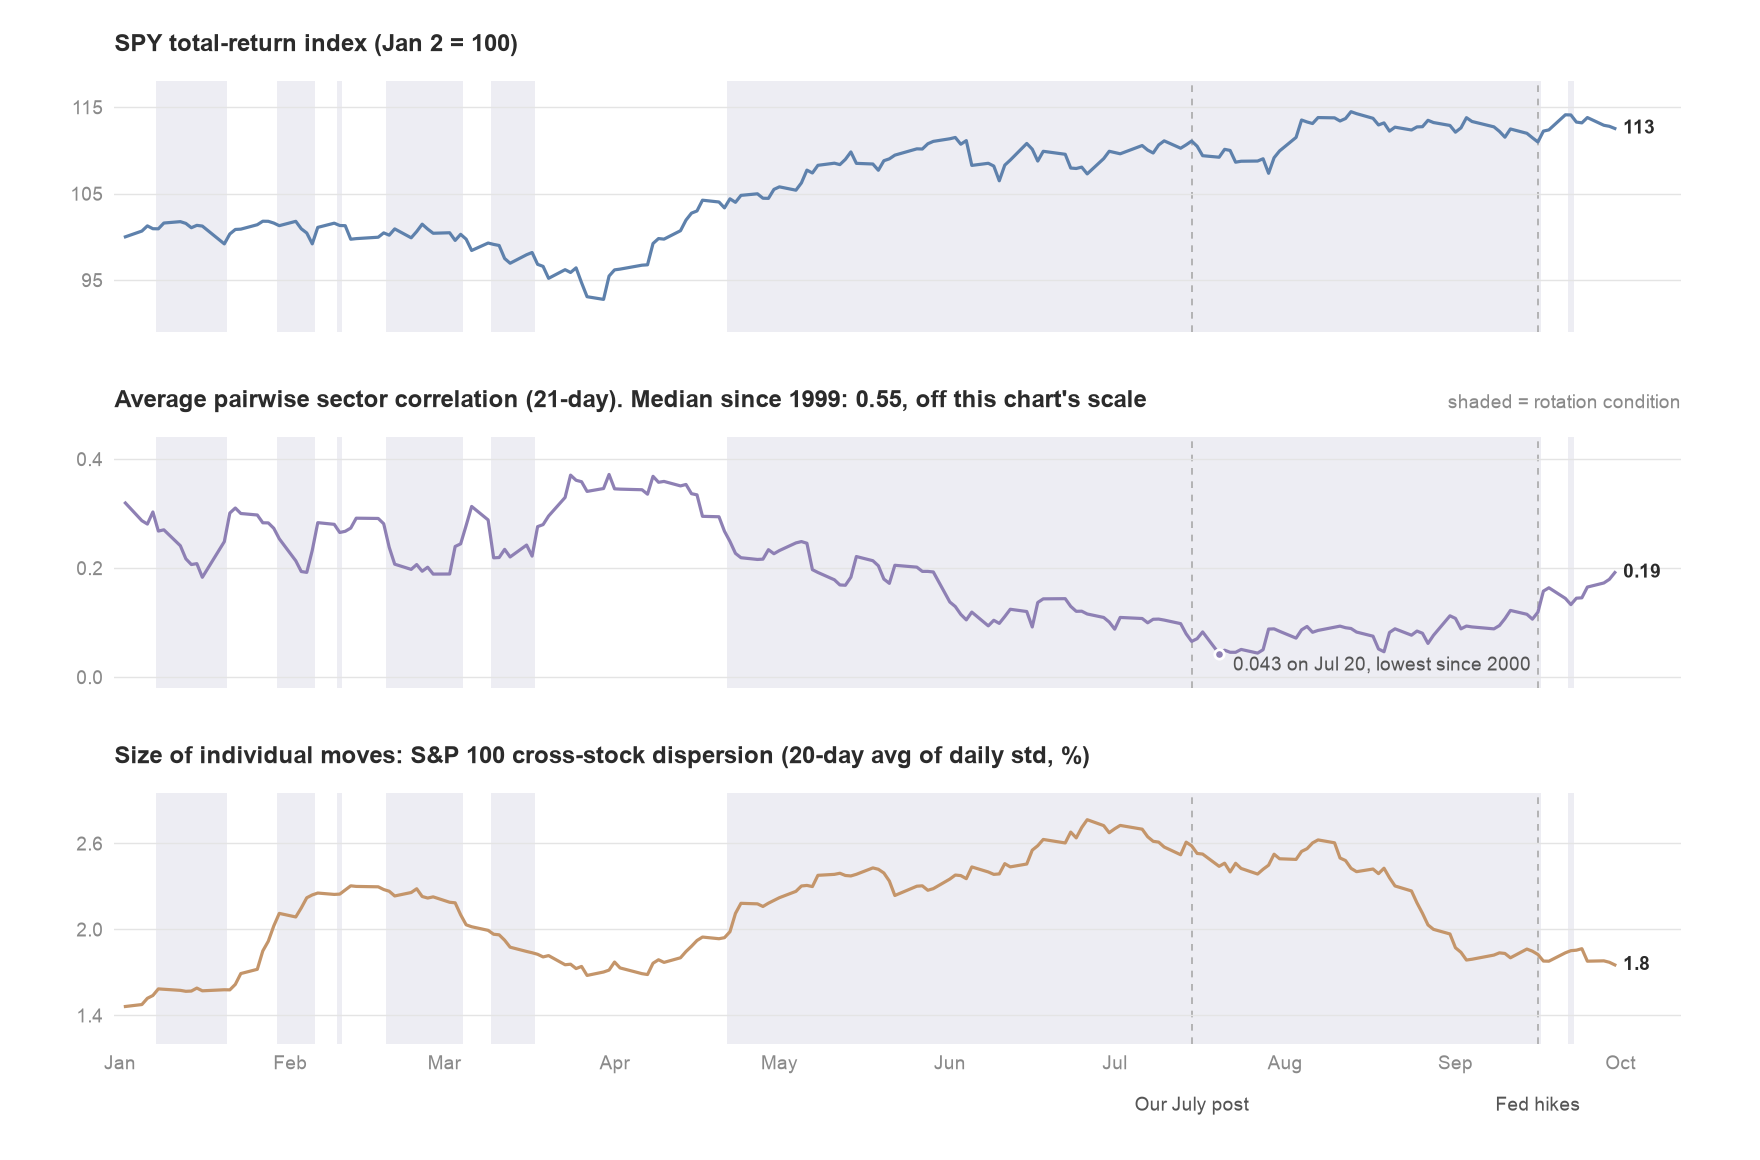
Correlation kept falling after we published in July. Our measure, the average pairwise correlation of the nine sector ETFs over a rolling month, read 0.105 in the data behind the July post. It bottomed at 0.043 on July 20, lower than any reading in our 27-year record outside the summer of 2000, and stayed near that floor through August.
September reversed the direction. Correlation roughly doubled in three weeks, from 0.09 on September 8 to 0.19 at the end of the month. The rotation condition we track, sector correlation in the bottom tenth of its own trailing three-year range, had held for 102 consecutive sessions, the longest run in our sample by a wide margin. The next longest was 70 sessions, in 2006. The streak ended the day after the Federal Reserve raised rates on September 16.
Even so, 0.19 is still in the bottom 5% of every reading since 1999, and the long-run median is 0.55. The market is less decorrelated than it was. It is still far from correlated.
The two tripwires
In July we identified two conditions that separated the episodes that became tops from the ones that resolved higher. Neither has triggered. One is closer than the other.
The trend breaking while correlation stays floored. In August 2000 and late 2021, the market’s trailing three-month return rolled negative while the rotation was still running. Today the S&P 500’s three-month price return is +2.3%, down from roughly 10% when we wrote, and the index closed September at 7,654, 1.9% below its August 13 record. The tripwire is not armed, but the cushion is thin. Over the next three weeks the three-month comparison runs against early- and mid-July closes, so a close below roughly 7,410 to 7,575 before October 21 would turn it negative. That is 1.0% to 3.2% below the September 30 close. Correlation has left the bottom tenth of its own three-year range, but by the full 27-year record it is still in the bottom 4%, so a break in the next few weeks would still happen inside a decorrelated market.
Correlation snapping higher while individual moves stay extreme. Sector correlation is rising, but the size of individual moves is falling with it. The average stock in the S&P 100 was moving at a 37% annualized volatility in mid-July; over the past month it is 27%. Correlation between those individual stocks has barely changed, at about 0.1 then and now. Sectors moving together more while stocks move less is the benign way for a rotation to cool. For scale, the snap in late 2021 took sector correlation from 0.21 to 0.61 in four weeks, ahead of the January 2022 top. September’s move was from 0.09 to 0.19.
The third distinction from July, how an episode starts, has not changed. This one began inside a healthy uptrend, and in our sample all seven of the strictest episodes that began that way still had their trend intact six months later.
Credit is no longer quiet
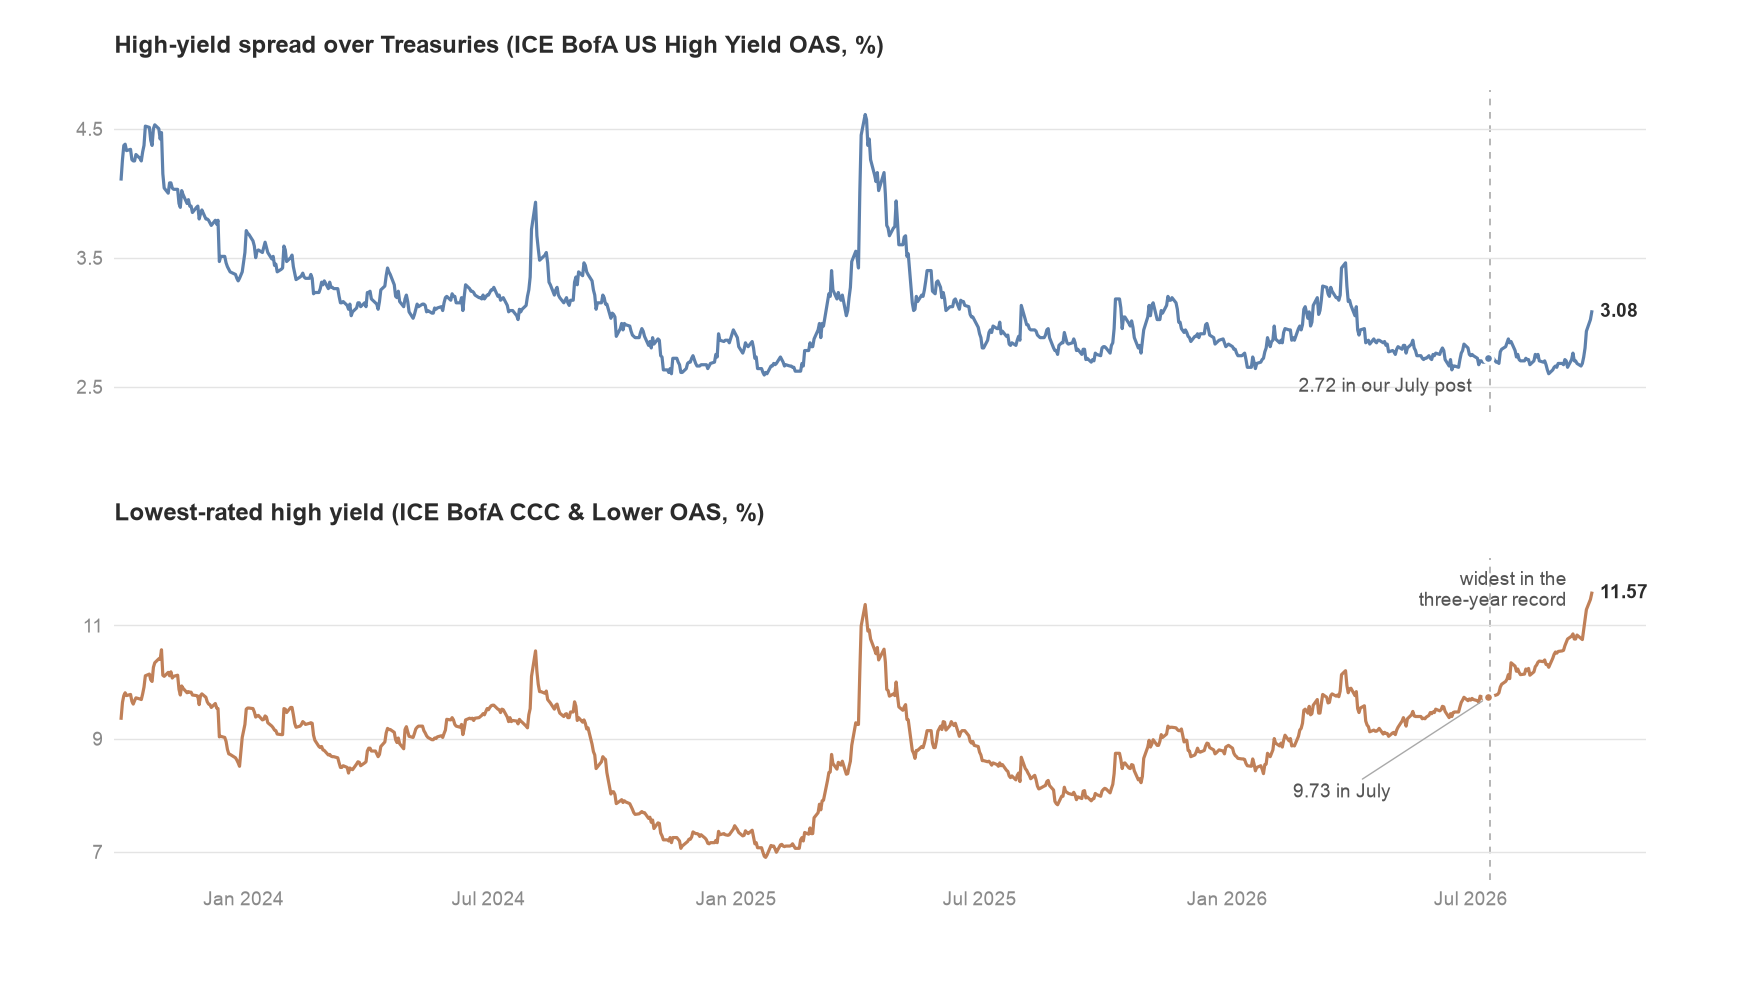
In July we pointed to credit as the missing ingredient. The 2007 top arrived with a bond market pricing stress months before equities accepted it. In July, high-yield spreads sat at 2.72%, in the tightest tenth of the prior three years, having moved one basis point through a month in which software stocks repriced by 20% and 30%. We called it a tell we would expect to fire early if this rotation were something worse.
It has started to move, from the bottom up. Spreads on CCC-rated bonds, the weakest borrowers, have widened steadily since July, from 9.7% in mid-July to 11.6% on September 29, the widest in the three years of data available. For most of that stretch the broader market ignored it: the high-yield index spread was still 2.73% on September 23. It then widened 35 basis points in four sessions to close September 29 at 3.08%, a move larger than 97% of four-day changes over the past three years. BB and single-B spreads are about 25 basis points wider than in July. Investment-grade spreads are 0.84%, only five basis points wider.
That is not yet the 2007 pattern, and broad measures of financial conditions were still loose at their latest readings. But the tell we said would fire early is no longer silent.
Breadth has narrowed under a flat index
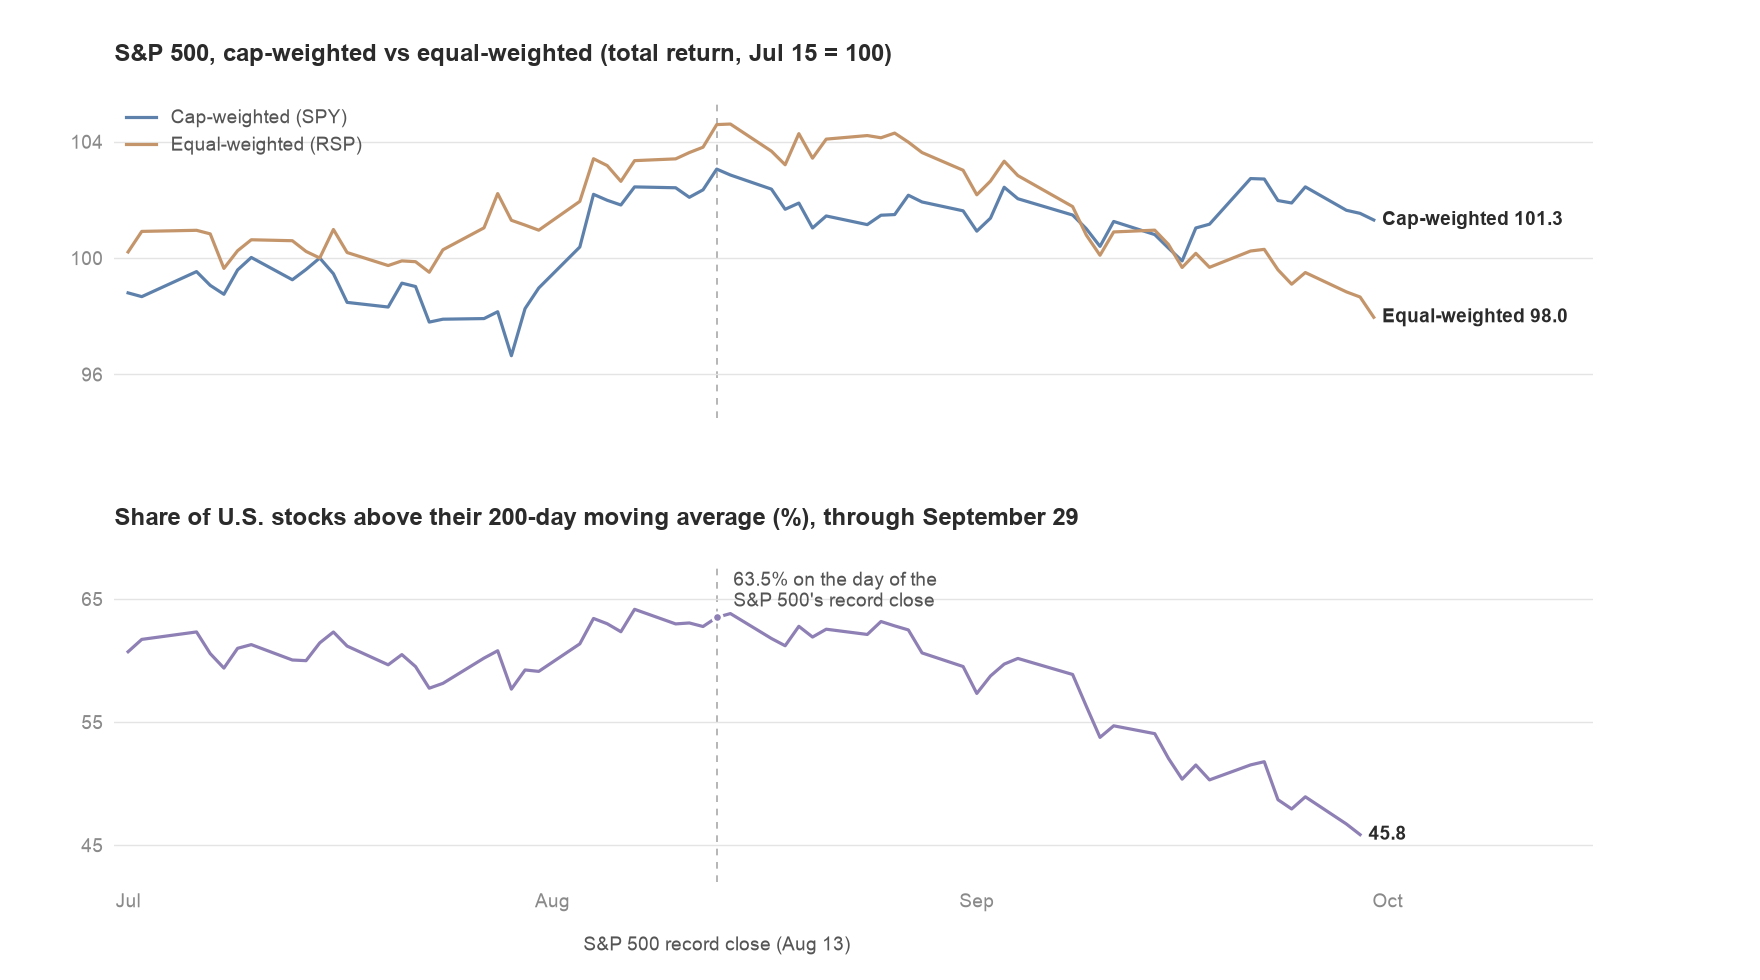
September looked uneventful at the index level. SPY, which tracks the cap-weighted S&P 500, returned −0.3% for the month including dividends. RSP, which holds the same 500 stocks in equal weights, returned −4.9%. On a rolling one-month basis, that gap is wider than 98% of readings since 2005. In the S&P 100, 73 of the 100 stocks fell in September, with a median decline of 5.1%. The equal-weighted index had been ahead of the cap-weighted one from our July post through the end of August; the gap opened entirely in September.
The broader market shows the same thing. When the S&P 500 set its record on August 13, 63.5% of the roughly 4,800 U.S. stocks we track traded above their 200-day moving averages. On September 29 the share was 45.8%, and new 52-week lows had outnumbered new highs for 16 consecutive sessions.
What moved in September
The common thread was rates. The Federal Reserve raised its policy rate by a quarter point on September 16, to a range of 3.75% to 4.00%, its first increase since 2023 (Federal Reserve), and 16 of the 18 officials projected another increase this year (CNBC). The 10-year Treasury yield closed at 5.24% on September 28, its highest since June 2007. The 30-year reached 5.56%, above its 2007 peak, and the inflation-adjusted 10-year yield rose to 2.90%, its highest since late 2008. Oil added pressure: Brent crude closed above $100 on September 9 for the first time since May as fighting between the U.S. and Iran escalated in the Persian Gulf (CNBC).
The sector data fits that backdrop. Rate-sensitive sectors fell together in September: materials, financials, real estate, consumer discretionary and utilities each lost between 5.9% and 7.2%, and technology was the only sector of the eleven to rise, gaining 5.0%. When one macro variable pushes several sectors the same way, sector correlation rises even as individual stocks grow calmer, which is the pattern in the first chart. The same force shows up across asset classes. Over the past 60 sessions, daily returns on stocks and long-dated Treasuries have been positively correlated at +0.49, so bonds have been moving with stocks rather than cushioning them.
Leadership keeps turning over
In July we said leadership change is a property of rotation regimes, not evidence of breakage, and named the tape’s new leaders: financials, utilities, industrials and healthcare. Since then utilities have fallen 12.1%, industrials 7.1% and financials 5.3%. Healthcare, up 6.7%, is the one July leader still leading, alongside energy (+9.3%) and technology (+7.9%). Inside technology the churn is sharper still. In September, Intel rose 34%, AMD 30% and Meta 27%, while Intuit fell 23% and Adobe 18%. The turnover is still the regime doing what it does. The new information is in credit and breadth.
The low-volatility trap is still set
The index is calmer than it was in July. The VIX closed September at 16.3, and the S&P 500’s realized volatility over the past month is under 11%. Part of that calm is real, because individual stocks are moving less. The rest is the same netting we described in July. Correlation among the largest U.S. stocks is still in the bottom 5% of the past two decades, and on a like-for-like basis, the jump in index volatility that a return to normal correlation would bring is only slightly smaller than when we wrote. What has changed is the backdrop. A single macro driver pulling on every sector at once, which is what rising rates are, is the kind of force that can pull correlation back toward normal.
What we are watching
The three-month trend. A close below roughly 7,410 to 7,575 before October 21 turns it negative. With correlation still this low, that would match the configuration that preceded the 2000 and 2021 tops.
How far up the quality ladder credit moves. So far the widening is led by CCC. Single-B, BB and investment-grade spreads joining it would be the broadening the 2007 top came with.
Correlation and move size together. Correlation rising while individual moves grow again, rather than shrink, is the snap.
The calendar. September payrolls on October 2, minutes of the Fed’s September meeting on October 7, the start of third-quarter earnings on October 13, and September CPI on October 14.
Blackworks Capital’s strategies are systematic, built around our Five Forces framework, and research like this is where they come from. We study conditions like this rotation to decide what our rules should measure and how they should respond, and we test those rules across decades of data before they manage capital. Several of the measures in this piece already shape our strategies: trend, the relationship between bonds and equities, commodity prices and volatility all inform how much risk our systems carry. Others, including breadth and credit spreads, feed the regime tracking we review every day and the research behind our next rules. Through the end of September that tracking shows an intact trend that has thinned, a rotation cooling in the benign way, and two measures, credit and breadth, that were quiet in July and are not now. The research shapes the rules, and the rules make the decisions.
Prices through the close of September 30, 2026; breadth and credit spreads through September 29, the latest available at writing. Sector correlation is the average pairwise correlation of daily returns of the nine original Select Sector SPDR ETFs over a rolling 21-trading-day window, from 1999. Large-cap measures use the S&P 100. Breadth covers roughly 4,800 U.S.-listed stocks. Credit spreads are ICE BofA option-adjusted spreads and Treasury yields are constant-maturity yields, both via FRED. Index levels are S&P 500 closing prices.
DISCLAIMER
Any description or information involving investment processes or allocations is provided for illustrative purposes only and does not constitute investment advice nor an offer or solicitation to subscribe for any security or interest. Any statements regarding correlations or other similar behaviors constitute only subjective views, are based upon reasonable expectations or beliefs, and should not be relied on. All statements herein are subject to change due to a variety of factors including fluctuating market conditions and involve inherent risks and uncertainties both generic and specific, many of which cannot be predicted or quantified and are beyond Blackworks Capital’s control. Future evidence and actual results or performance could differ materially from the information set forth in, contemplated by or underlying the statements herein. Blackworks Capital accepts no liability for any inaccurate, incomplete or omitted information of any kind or any losses caused by using this information. Blackworks Capital does not give any representation or warranty as to the reliability or accuracy of the information contained in this document.