
Treasury Intervention: History Rhyming

I recently got a text from one of our partners asking my thoughts on treasuries at current levels, or current as of yesterday I suppose. As someone who is never shy about providing my thoughts on the markets, economic theory, or fly fishing, I was happy to have a little discussion and provide my thoughts. Unfortunately, they didn’t ask about fly fishing, I’d have been more than happy to go do a little research on current river conditions, I need a little river therapy, haven’t been doing nearly enough of that this summer, but I digress.
So I provided my thoughts, mostly that I had reservations about Treasuries and yields coming down so long as inflation continues to run above target, deficits remain un-controlled, and oil remains elevated and I wasn’t sure I saw anything that would lead me to believe any of those issues were topping and I’d like to see some progress and rates moving down for the “right” reasons before I got too bullish, more on that later. As is normally the case with these topics, if we are discussing it, it’s likely because it’s bubbling up and getting attention in the public sphere. With 30-year treasury rates nearing 20-year highs at 5.3%- and 10-year yields getting closer to 5%, it felt inevitable that something was going to break or require a response. Little did we know that response was quite literally coming the following morning with the Treasury department announcing an intervention targeting the long end of the yield curve by re-purchasing long dated treasuries.
With such a meaningful intervention, I thought I better do a little more research on this topic and dig into it rather than simply providing my casual thoughts because there is a lot here to discuss and significant implications not just in the short to medium term, but more importantly to a systematic fund like ours. In addition, this impacts the long term functioning of the markets as well as impacts to moral hazard and market mis-trust that comes from actions like these.
I can hear people shifting in their chairs getting ready to quickly type up a comment. “What are you talking about ‘moral hazard’?” “Why does this create any trust issues? Doesn’t this provide assurance to the market that the admin is on top of the issue and working to lower rates?” We’ll get to those, and others are probably sitting there asking “Rogan, what are you even talking about? What happened?” or maybe you are simply asking what any of this has to do with systematic investing at all? Let’s get to all of these because this is a fascinating topic and unfolding in real-time, so buckle up because we’ve got a lot to talk about.
First things first: what just happened?
The announcement
This morning the Treasury Department announced that it is at least doubling the size of its liquidity support buyback operations in the longer-dated nominal coupon sectors, specifically the 10-to-20-year and the 20-to-30-year buckets. The maximum size per operation goes from $2 billion to at least $4 billion, the frequency of those long-end operations doubles from two per quarter to four, and the total quarterly capacity across all sectors rises from $30 billion to $38 billion. The new sizes take effect September 9 and run through November 4, the end of the current refunding quarter (U.S. Treasury).
The tape did what you would expect. The 10-year fell 6 basis points to 4.647% and the 30-year fell 9 basis points to 5.196% (CNBC). The dollar softened, gold caught a bid, and everybody who is long duration exhaled for the first time in about six weeks. These prices were all grabbed in real-time this morning and I'd fully expect the market to move wildly over the coming hours and days so please don't take them as exact numbers but rather directional sign posts.
For context on why this happened at all: two days ago, on August 17, the 30-year printed 5.31%. You have to go back to June 12, 2007 to find the last time it traded up there. It is worth seeing that on a chart with some road behind it, because the whole professional memory of most people trading this market was formed inside the dip in the middle, myself included.
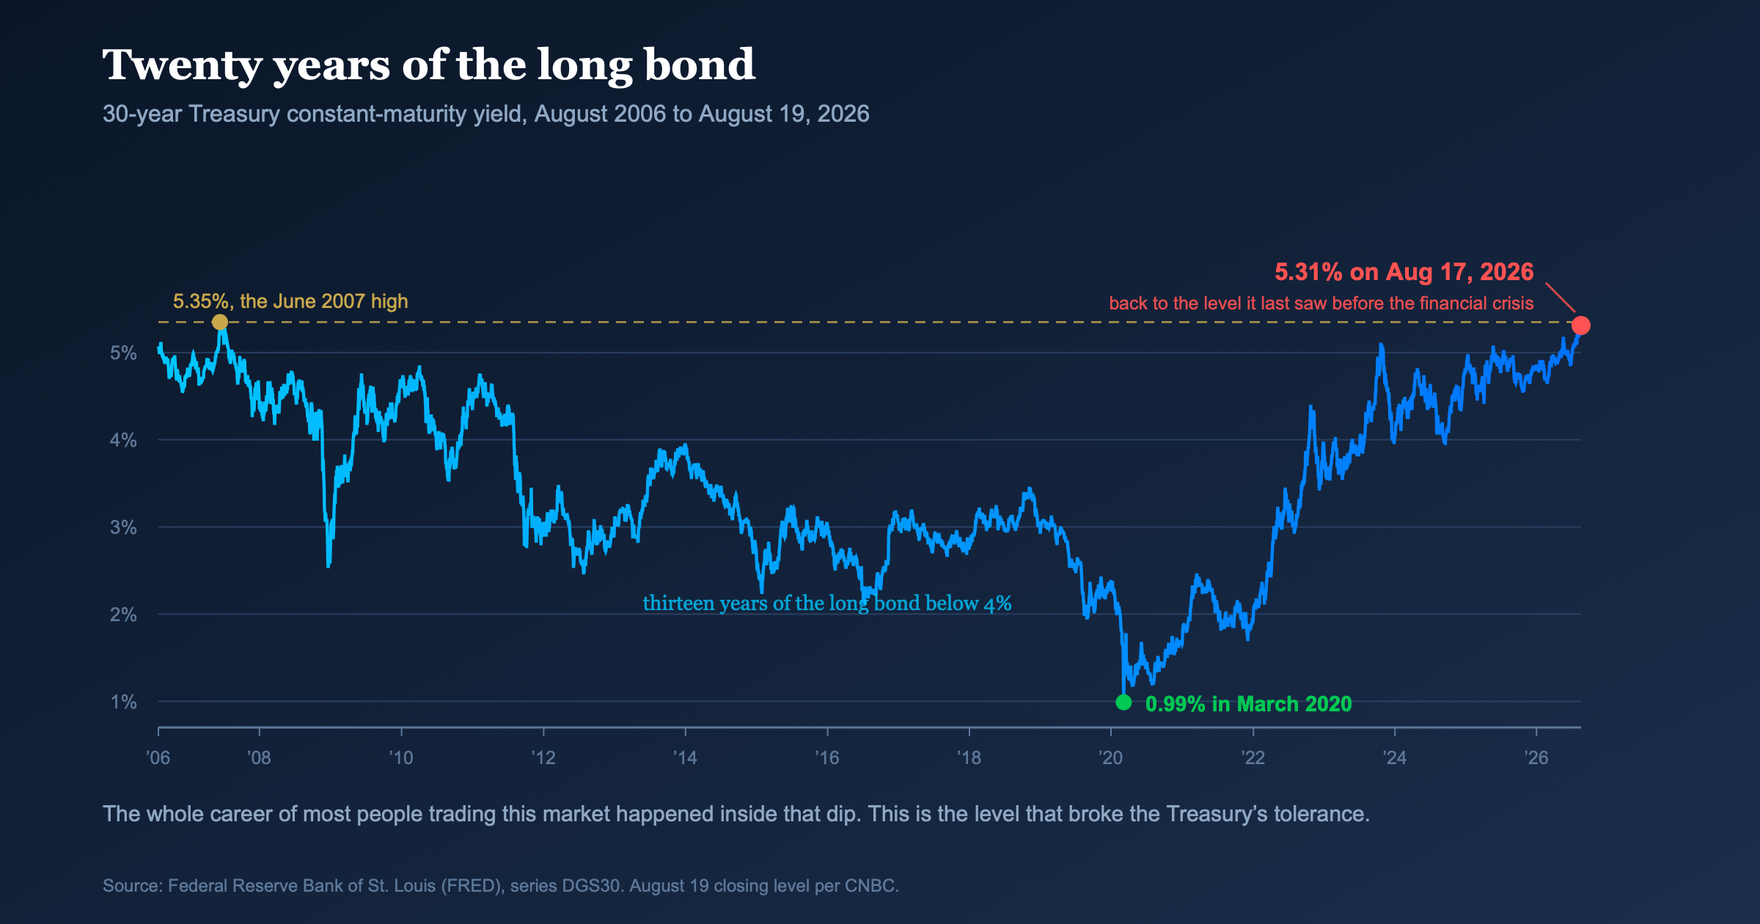
So the sequence is not complicated. The long end went to a 19-year high on a buyers’ strike that had been running since late June, and forty-eight hours later the issuer of the paper announced it was going to buy more of it. That’s the news. Now let’s talk about what it is.
This is not a paydown
Treasury is not retiring debt. The total stock of debt outstanding does not change by one dollar because of this program. What changes is the maturity mix, and that distinction is the whole ballgame.
Treasury’s own published operating language on buybacks tells you how the funding works. Amounts spent to buy back securities are “treated like any other source of borrowing needs for debt management purposes,” and Treasury “will not attempt to directly align additional issuance with securities bought back at a specific tenor” (Treasury, Q2 2024 refunding supplement). Put that next to the forward guidance from the August refunding, which says coupon and FRN auction sizes will hold at current levels “for at least the next several quarters” (Fortune), and the mechanic falls out of the algebra with no interpretation required.
If you buy back long bonds, and you promise not to increase long bond auctions, then the money to buy them back comes from bills.
That is the entire trade. Treasury absorbs duration out of private hands and hands back Treasury bills. The public ends up owning less interest-rate risk and more money-like paper. The term premium compresses. The long end rallies.
If that sounds familiar, it should. It is functionally the Fed’s Operation Twist, executed from the fiscal side of the house instead of the monetary side, and without anybody at the FOMC casting a vote on it.
So what does it cost? Two things.
The first is rollover risk. The weighted average maturity of the debt shortens. You have traded a liability locked in at 5.2% for thirty years for paper that reprices every thirteen weeks. If inflation stays where it is, every bill auction from here clears at the elevated rate, forever, until it doesn’t. Rising interest costs were already the single largest driver of the increase in Treasury outlays this year, up $120 billion, and total annual interest expense now runs above $1 trillion, more than the defense budget (Fortune).
The second cost is that it doesn’t work at scale, and the arithmetic is not close.
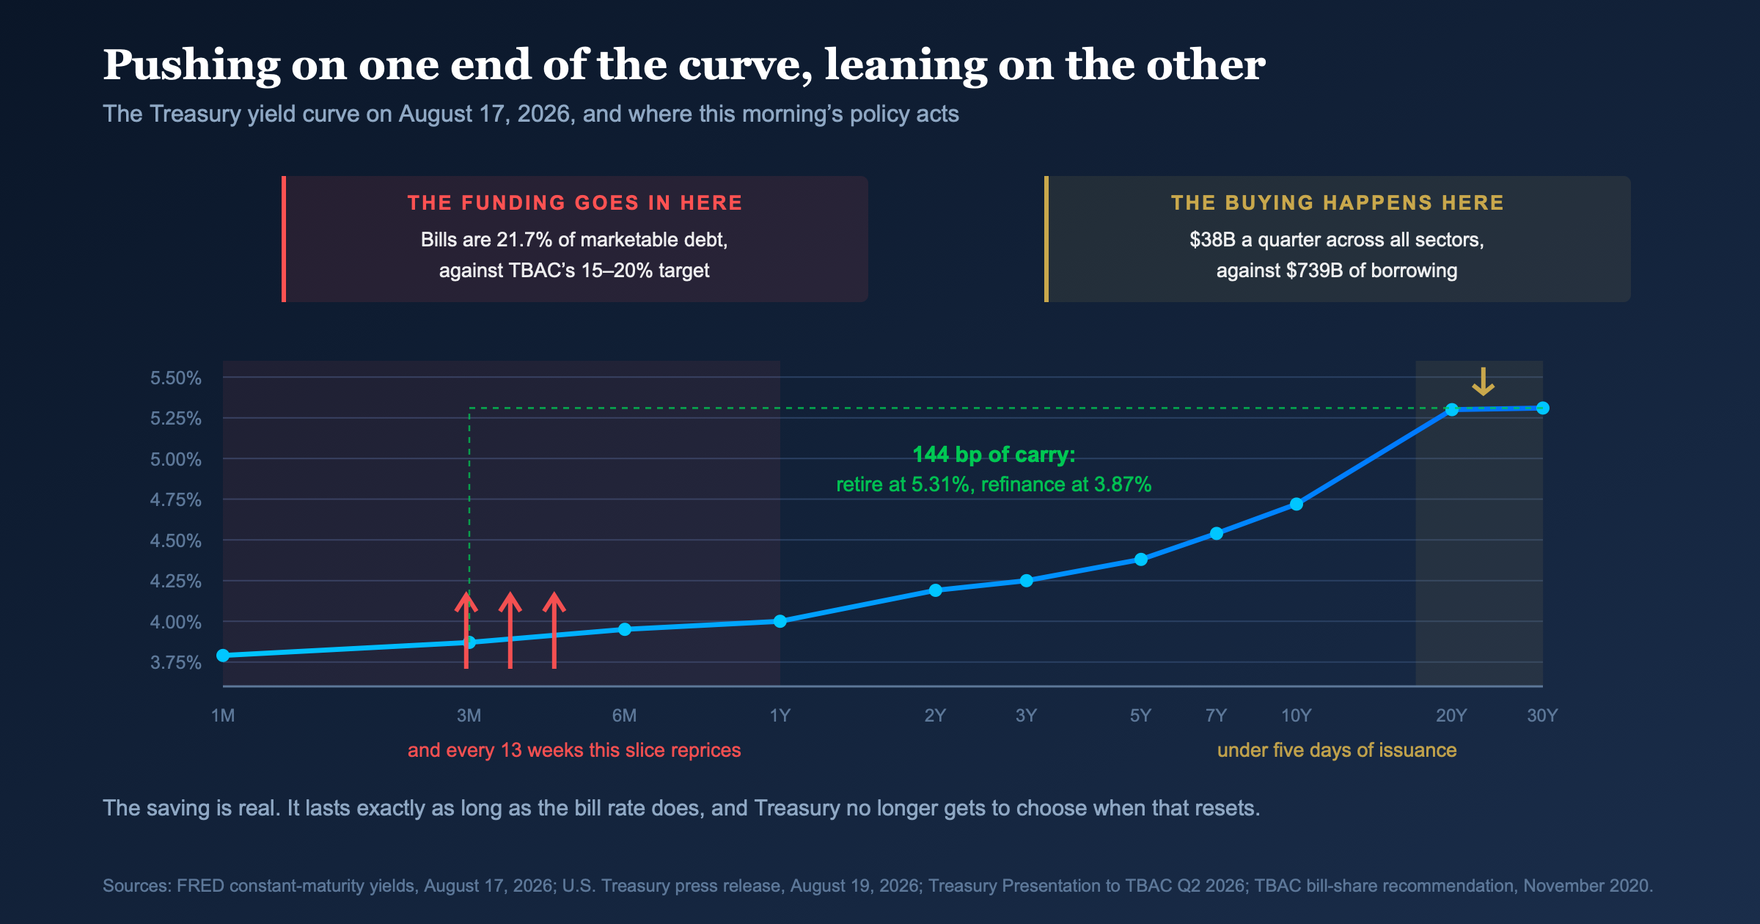
Treasury’s net marketable borrowing estimate for the current quarter is $739 billion, revised up by $68 billion from the May estimate. That is about $8 billion a day, every day, for ninety-two days. Against that, the entire buyback program across every sector and every tenor is $38 billion a quarter, which is under five days of borrowing. The increase announced this morning, the thing that moved the 30-year nine basis points, is roughly $8 billion, or one day.
So the intervention itself is a drop in the bucket. What is not a drop in the bucket is where the funding lands. Every dollar of long bonds retired arrives as bills at the front end of a curve that is already carrying more bill supply than the Treasury’s own advisory committee thinks it should. You are relieving pressure on the tenor everybody watches by adding it to the tenor that clears the plumbing.
You cannot out-buy your own issuance, and nobody at Treasury thinks you can. This is a shock absorber rather than a cure. The Treasury Borrowing Advisory Committee has already flagged that at current auction sizes the government faces a $1.45 trillion funding shortfall in fiscal 2027–28, and bills already sit at 21.7% of outstanding marketable debt as of April 30, above the 15–20% range TBAC itself recommends as the medium-term target.
So we are above the recommended bill share, we are guiding to no increase in coupon sizes, and we are now doubling the rate at which we retire coupons and replace them with bills. All three of those push the same direction.
Ok that makes sense, but does it cost more?
In cash terms, yes, and one line from a real operation makes it obvious.
On March 4 of this year Treasury bought back $55 million of an old bond carrying a 0.625% coupon, paying 88 cents on the dollar for it. That bond was costing the government $344,000 a year. The bills raised to pay for it cost about $1.88 million a year. Treasury spent real cash to retire a nearly free liability, and quintupled the cost of carrying it.
That line is the extreme case, but the direction holds across the whole operation. Twelve issues, $2.46 billion of par, average coupon 3.79%. Treasury retired $93 million a year of coupon and picked up $96 million a year of bill cost. Slightly more expensive today, and the gap only widens from here, because those bills reprice every thirteen weeks and the coupons it retired never would have.
Measured against the long end the trade still makes sense. Retire paper priced off 5.31%, fund at 3.87%, keep the 144 basis points in between. That is the reason to do it, and it is also the risk, because the government has now taken the same side of the same duration mismatch that took down Silicon Valley Bank, at a size where nobody can post collateral against it.
The Treasury department has run this play before
The version of this story circulating today is a little too clean, so let me give you the whole thing.
In the autumn of 2023 the long end was doing what it is doing now. The 30-year peaked at 5.11% on October 19, 2023, in what everyone at the time called a buyers’ strike. On November 1, Treasury came in with a refunding slate lighter on coupons than dealers had positioned for, and leaned harder on bills.
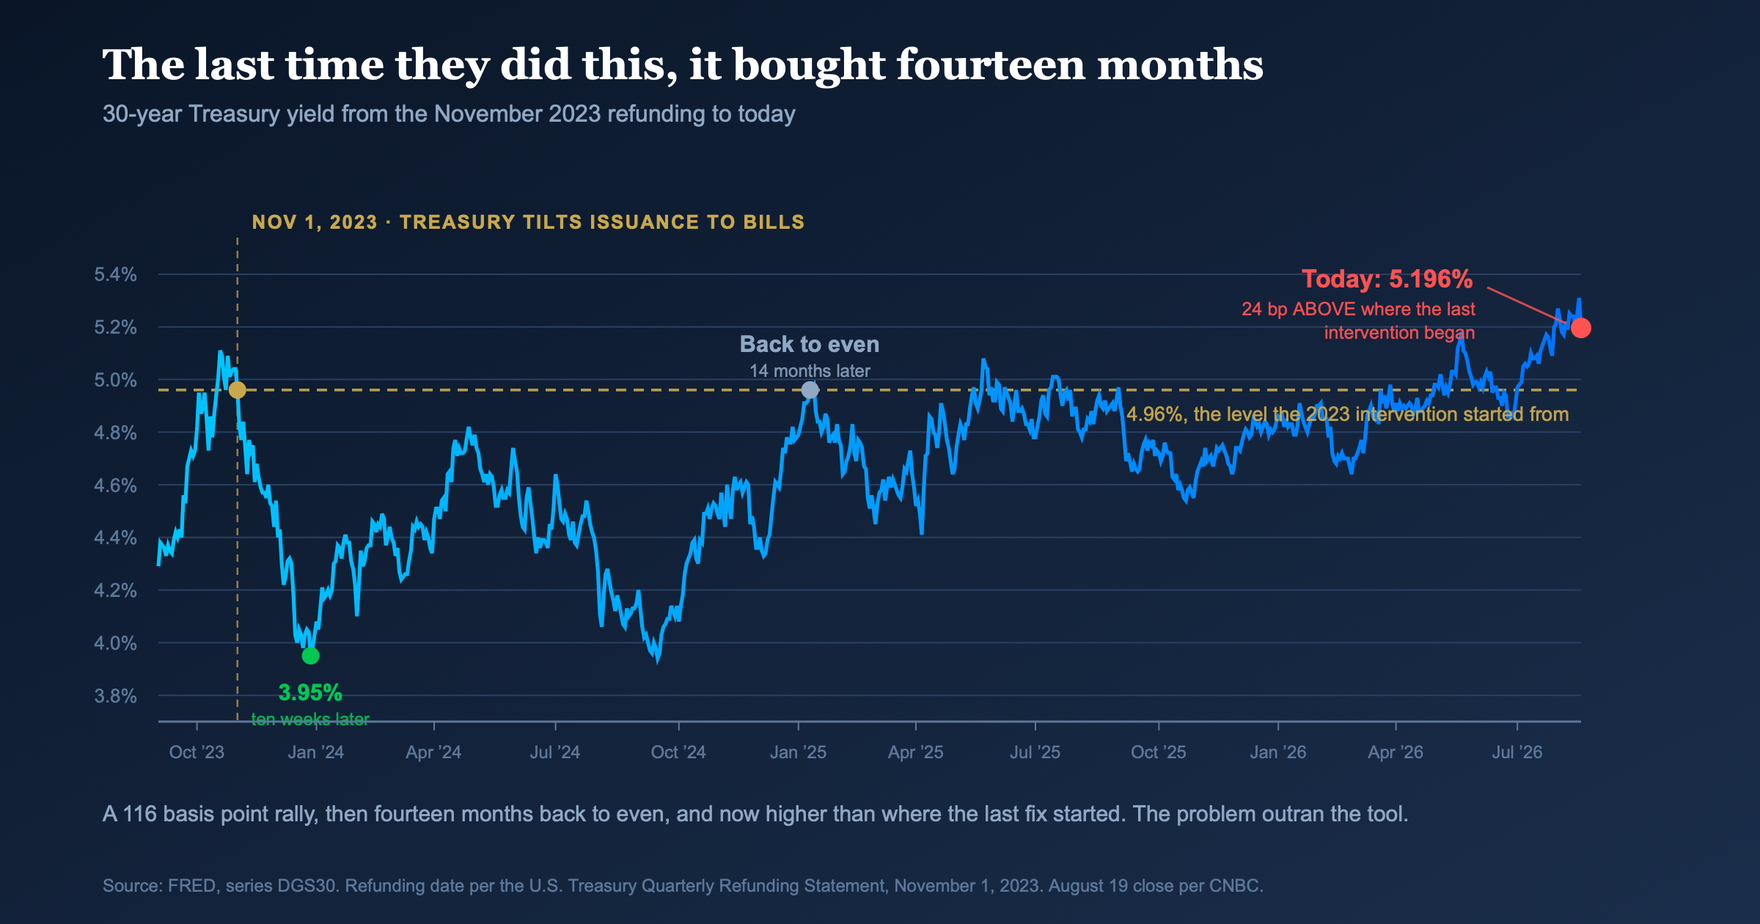
What followed was violent. The 30-year went from 5.11% to 3.95% by December 27, which is 116 basis points in ten weeks. Then it gave 87 of them back by late April 2024.
Two things are true about that episode and most people only tell you one of them.
The first is that it worked, and it worked for longer than the round trip suggests. Yields did not climb back to their pre-refunding level of 4.96% on the 30-year until January 10, 2025, fourteen months later. If you were short duration into that refunding you had a bad year, not a bad quarter. Anyone telling you issuance-mix management is impotent has not pulled the series.
The second is what happened after that, and it is the part I would put in front of anyone treating this morning as a fix. The 30-year did not stop at 4.96%. It kept going. Even after this morning’s nine basis point rally it sits at 5.196%, roughly 24 basis points above the level that triggered the last intervention, and Monday’s 5.31% was 35 above it. So the honest scorecard on the 2023 playbook is that it bought fourteen months of relief and then handed the problem back larger than it found it. The tool worked. The problem outran it.
And it did not do it alone, which is the other half of the story. On December 13, 2023, Powell’s FOMC blessed cuts, and CPI was cooling into the same window. The Fed and the Treasury were pushing in the same direction at the same time. That makes the 116 basis points a joint result, and there is no honest way to divide them between the two actors after the fact. You can observe the move. You cannot attribute it, and any split between issuance policy and the Fed is an assumption someone has chosen rather than a finding in the data.
That is also what makes this morning different, and it is the single most important asymmetry in this piece.
In 2023, Treasury was easing into a Fed that was about to ease with it. Today, Treasury is easing into a Fed that is signaling a hike.
Kevin Warsh’s committee held the target range at 3.50–3.75% on July 29, on a 9-to-3 vote, and the Fed’s own projections point to rates a quarter point higher by the end of 2026, with officials explicitly citing the inflation spike tied to the war with Iran (Federal Reserve). The tailwind that made the 2023 intervention work is now a headwind, which is the difference between pushing a boulder downhill and pushing it up.
The people who wrote the case against it
Now for the part that stopped me when I went back through the research this morning.
The critique of this exact policy, the framework, the vocabulary, the whole intellectual apparatus, was built in July 2024 by Stephen Miran (yes, that Stephan Miran, the one recently asigned to the fed, since departed, but having worked for the current administration) and Nouriel Roubini in a Hudson Bay Capital paper titled “ATI: Activist Treasury Issuance and the Tug-of-War Over Monetary Policy.” Their argument, aimed at Janet Yellen’s Treasury, was that by tilting issuance toward bills, Treasury was “dynamically managing financial conditions and through them, the economy, usurping core functions of the Federal Reserve.” They estimated the effect at roughly 25 basis points off the 10-year, which they called “similar stimulus as a one-point cut in the Fed Funds rate.”
But the detail that got me is that the paper has a section on buybacks. Not a footnote, a section. In it, Miran and Roubini describe the instrument that Treasury deployed this morning, before it existed at scale, and explain why it would be a problem:
“If Treasury buys back old, off-the-run 7-year notes funded by increased bill issuance, there’s a net reduction in duration supply. Such a dynamic replicates the Fed’s version of Operation Twist... The buyback program is not a significant liquidity easing as currently constituted, as it is too small in size. However, as Treasury ramps it up, it may become so.”
And then the sentence I would tattoo on the wall of every debt management office in the world:
“Giving a political institution like Treasury authority over monetary-policy-like tools bears the same dangers as political interference in monetary policy... Once they are forged, there is little reason to expect useful tools won’t be employed repeatedly for stimulating markets and the economy at opportune moments.”
They wrote the manual. Two years later the desk is running the play at double the size, and the current window happens to close on November 4, the day after the midterm elections.
Scott Bessent, yes that Scott Bessent, the Treasury Secretary Scott Bessent that just announced this, then a private investor, amplified that critique loudly. He was, by Bloomberg’s account, among Yellen’s sharpest critics on precisely this point. He now sits in the chair, running the instrument the paper he promoted warned about.
The word for that is not hypocrisy, and reaching for it would let everyone off too easily. Bloomberg’s Jonathan Levin flagged the real dynamic back in February 2025, before any of this year’s stress: Bessent was going to keep Yellen’s playbook, and he was going to keep it because the arithmetic gives you no other choice. Whoever sits in that chair discovers the same thing, that the long end cannot absorb the supply a $2 trillion deficit requires it to absorb, and reaches for the same lever.
Sit with that for a second and it lands harder than hypocrisy would. If the constraint is arithmetic rather than ideology, then the 2024 critique was correct, the practice is now larger, and there is nobody left writing the paper.
Goldman’s read on this morning was that calling it shadow QE is “definitely a bridge too far, but it might be on a path that leads to that bridge.” I’d put it more plainly. This is the tug-of-war the paper’s title described, except now Treasury is pulling against a Fed leaning the other way rather than one about to join it.
The calendar
The moment you mention an election in a market piece, half your readers assume you have picked a team, so let me set out what I am and am not saying.
I am not asserting a motive. I have no way to know one, and neither does anybody else writing about this today. What I am doing is reading the calendar next to the auction schedule, which anybody can do and which I would consider basic diligence.
The buyback expansion takes effect September 9 and runs through November 4, 2026. The midterm elections are November 3, 2026. The program, as announced, covers the eight weeks into the election and expires the day after it.
Set that next to the precedent. Yellen’s issuance shift landed on November 1, 2023, and the bill-heavy posture it established ran straight through the November 2024 general election. That is the pattern Miran and Roubini flagged, and they flagged it in general terms rather than partisan ones:
“There is no reason to expect this policy innovation of using the issuance profile to avoid tightening financial conditions will not become normal practice in Washington. Both parties will want to use all tools available to them, and once activist issuance policy becomes a tool for manipulating markets during election season, it is likely to become a new norm for both parties. Neither party will have an interest in unilaterally standing down.”
Two administrations, two parties, two interventions in the long end, both landing in the run-up to a national election, and each side accusing the other of exactly this while doing it themselves.
The uncomfortable part isn’t the hypocrisy. It’s that the incentive is structural and nobody has any reason to be the first to stop. Long-end management is a short-duration fix, and short-duration fixes get chosen because political horizons are short. Nobody holding office is optimizing a thirty-year liability, they’re optimizing the next fourteen months, and the rollover risk lands on somebody else’s desk by design.
Which is the whole reason I keep saying this is an institutional read rather than a partisan one. If the tool works, and it is available, and using it is rewarded on a two-year cycle while the cost shows up on a twenty-year one, then it gets used. Every time. By whoever is holding it.
That is what Miran and Roubini called a political business cycle, and their warning was that it eventually gets priced in the form of higher equilibrium inflation and higher long-run yields, because investors learn to expect the stimulus regardless of whether the economy needs it. If that’s right, each of these interventions is borrowing basis points from its own future. The 30-year is where the bill arrives.
The overloaded piece
Here is the frame I kept coming back to while I was writing this, and it’s the reason I wanted to write this out more thoroughly rather than just texting my partner back and hopefully provides an additional view of how this all comes together.
In chess there is a concept called the overloaded piece. It isn’t a piece under attack. It’s a piece doing too many jobs at once, defending two or three squares simultaneously, all of which need it. The position looks fine. Material is even. Nothing is hanging. And then your opponent plays a move that forces the overloaded piece to choose, and the moment it moves to answer one threat, everything else it was holding together falls apart.
You don’t lose those games because you were down material. You lose them because one defender was carrying more than one defender can carry, and somebody noticed.
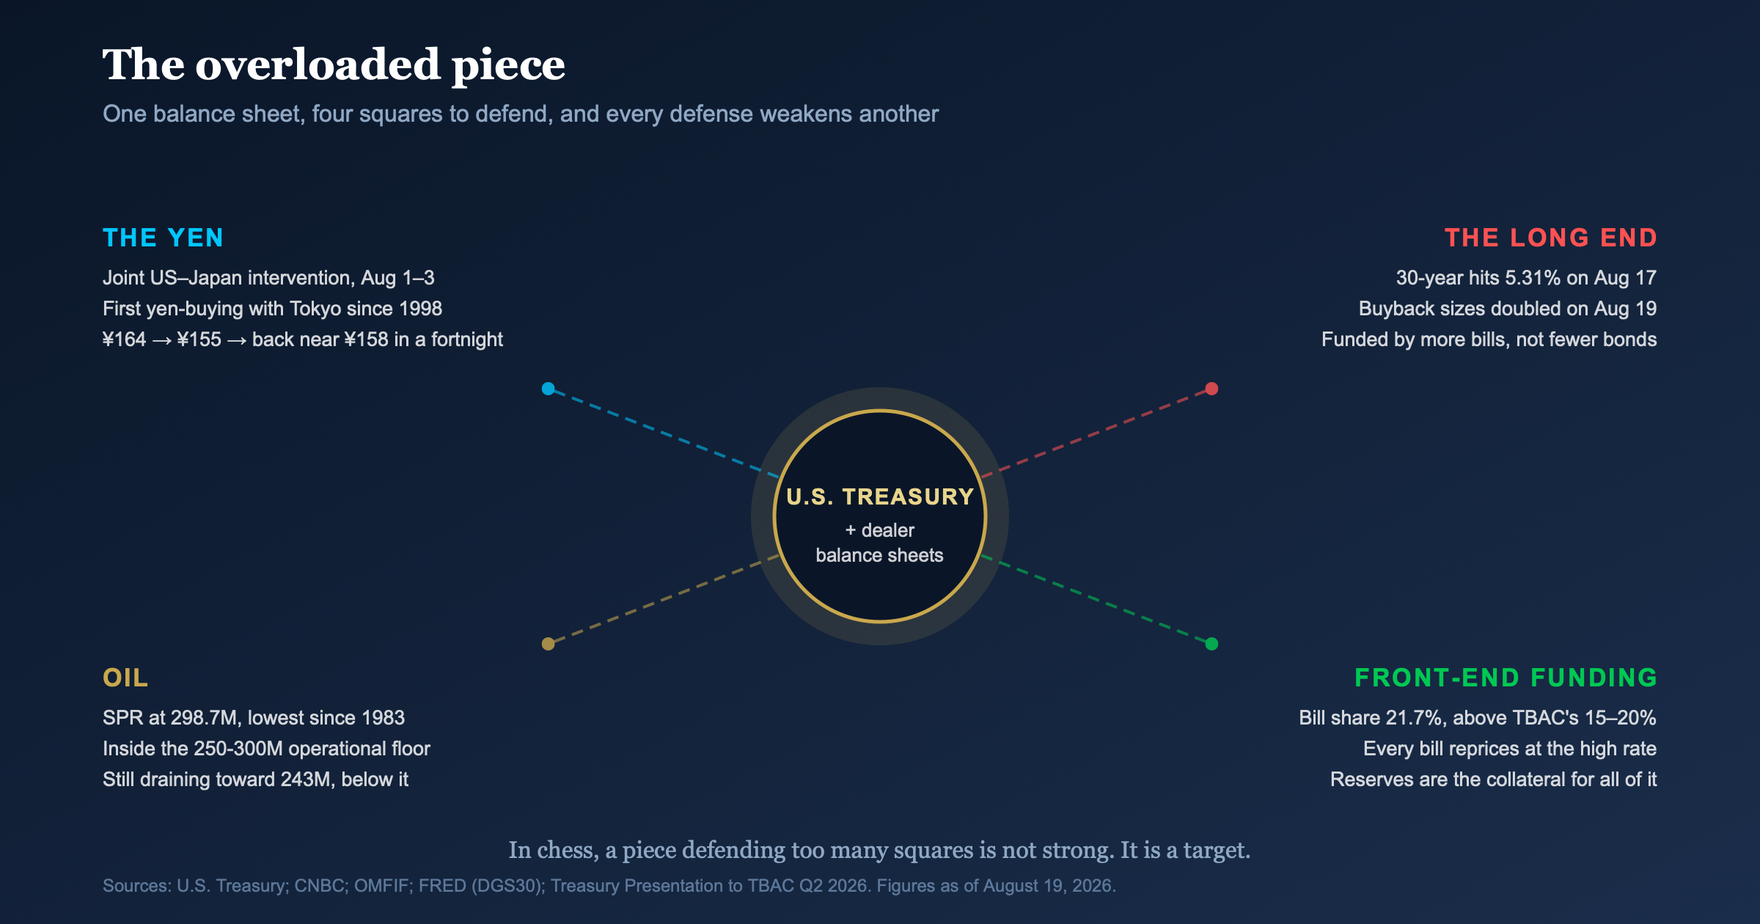
Count the squares the we are currently defending.
The yen. On August 1–3, the U.S. and Japan conducted a coordinated intervention to prop up the yen, the first joint yen-buying operation since 1998. Estimates put the Japanese side around $75 billion and the U.S. side somewhere between $5 and $10 billion (OMFIF, CNBC). Watch how it was financed: through the Fed’s FIMA repo facility, and using euros rather than dollars, specifically to avoid selling Treasuries. In other words, we defended the yen in a way carefully designed not to disturb the other square we were defending. The yen went from ¥164 to ¥155 and was back near ¥160 within a month.
Oil. The Strategic Petroleum Reserve held 298.7 million barrels in the week ending August 7, the lowest level since January 1983 (CNBC). That number matters more than a record headline usually does, because it is not simply a low reading. It is the floor. Siddharth Misra, a petroleum engineering professor at Texas A&M, puts the practical operational floor for the reserve at 250 to 300 million barrels (CNBC). We are inside that band right now.
Below it the problems stop being financial and turn physical, I'll spare you the technical details, you can go look that up if you'd like to know how the actual SPR functions, think big underground caves. The reserve loses the ability to pump fast enough to answer an emergency, which is the entire reason for holding it. The selling is also not finished. The 172-million-barrel emergency release authorized in March is still being executed, and the EIA has the reserve landing near 243 million barrels once it completes, which is underneath the operational floor entirely.
Now set the refill against that. The reserve empties about six times faster than it fills, 4.4 million barrels a day out against a maximum 785,000 a day back in, and S&P Global reckons a full refill runs to 2031 at the earliest. So the government does not simply stop being the marginal seller and become the marginal buyer. It becomes a buyer that has to keep buying for years, into a market that can see it has no choice.
The long end. This morning’s announcement.
The front end. Which is where the buyback funding goes, and where the bill share already sits above the recommended range.
Here is what makes it a chess problem instead of a list. These are not four independent defenses. They are the same defender trying to cover all of them.
Buy back the long end and you fund it with bills. More bills drain the cash sitting in the Fed’s reverse repo facility, and once that facility is empty the next marginal buyer has to come out of bank reserves, which are the same reserves that clear every repo trade in the system. We have seen how that ends. September 2019: reserves got scarce, overnight repo printed in the double digits intraday, and the effective fed funds rate broke the top of the target range. The Fed had not lost the ability to set rates, it had lost the ability to transmit them.
That failure mode does not announce itself as a bond market revolt, it shows up as a plumbing seizure. And the standard fix, the Standing Repo Facility followed by outright Fed purchases of bills to rebuild reserves, completes an absurd circle. The bill issuance used to suppress the long end eventually forces the central bank to create reserves to absorb the bills. You went all the way around the board and ended up monetizing anyway, and in 2019 we called it reserve management.
Meanwhile, defending the yen without selling Treasuries requires the FIMA facility, which is a claim on the same balance sheet. And the AI capex cycle currently holding GDP above stall speed is increasingly financed in private credit and vendor paper, funded out of the same front-end market the bill flood is squeezing.
Same defender, four threats. In chess that is a tactic waiting to happen. In market plumbing it is a repo spike.
One caution on my own metaphor, because it does break down in a specific place. You may think I'm going straight to Checkmate! That one doesn't follow unfortunately, in Chess, and likely here, when pieces get overloaded you tend to get a scenario where you get a long grinding endgame where the defender keeps finding one more tempo move to hold off the inevitable, but I don't think we are at Checkmate just yet. So the thing to watch isn’t any single level, it’s the interval, meaning how much time each fix buys before the next one is required. The 2023 issuance shift held the long end below its starting level for fourteen months. The yen intervention two weeks ago has already given back most of its move. When the next fix has to arrive before the last one has finished working, that’s the tell.
The wrong kind of inflation
There is a version of this story where NONE of the above matters, because inflation rolls over, the Fed cuts three or four times, the rate differential problem dissolves, the yen stops needing defending, and the long end comes down on its own. That is a coherent scenario, and it is the one everybody is praying for. So let’s look at whether the inflation we have is the kind that cooperates.
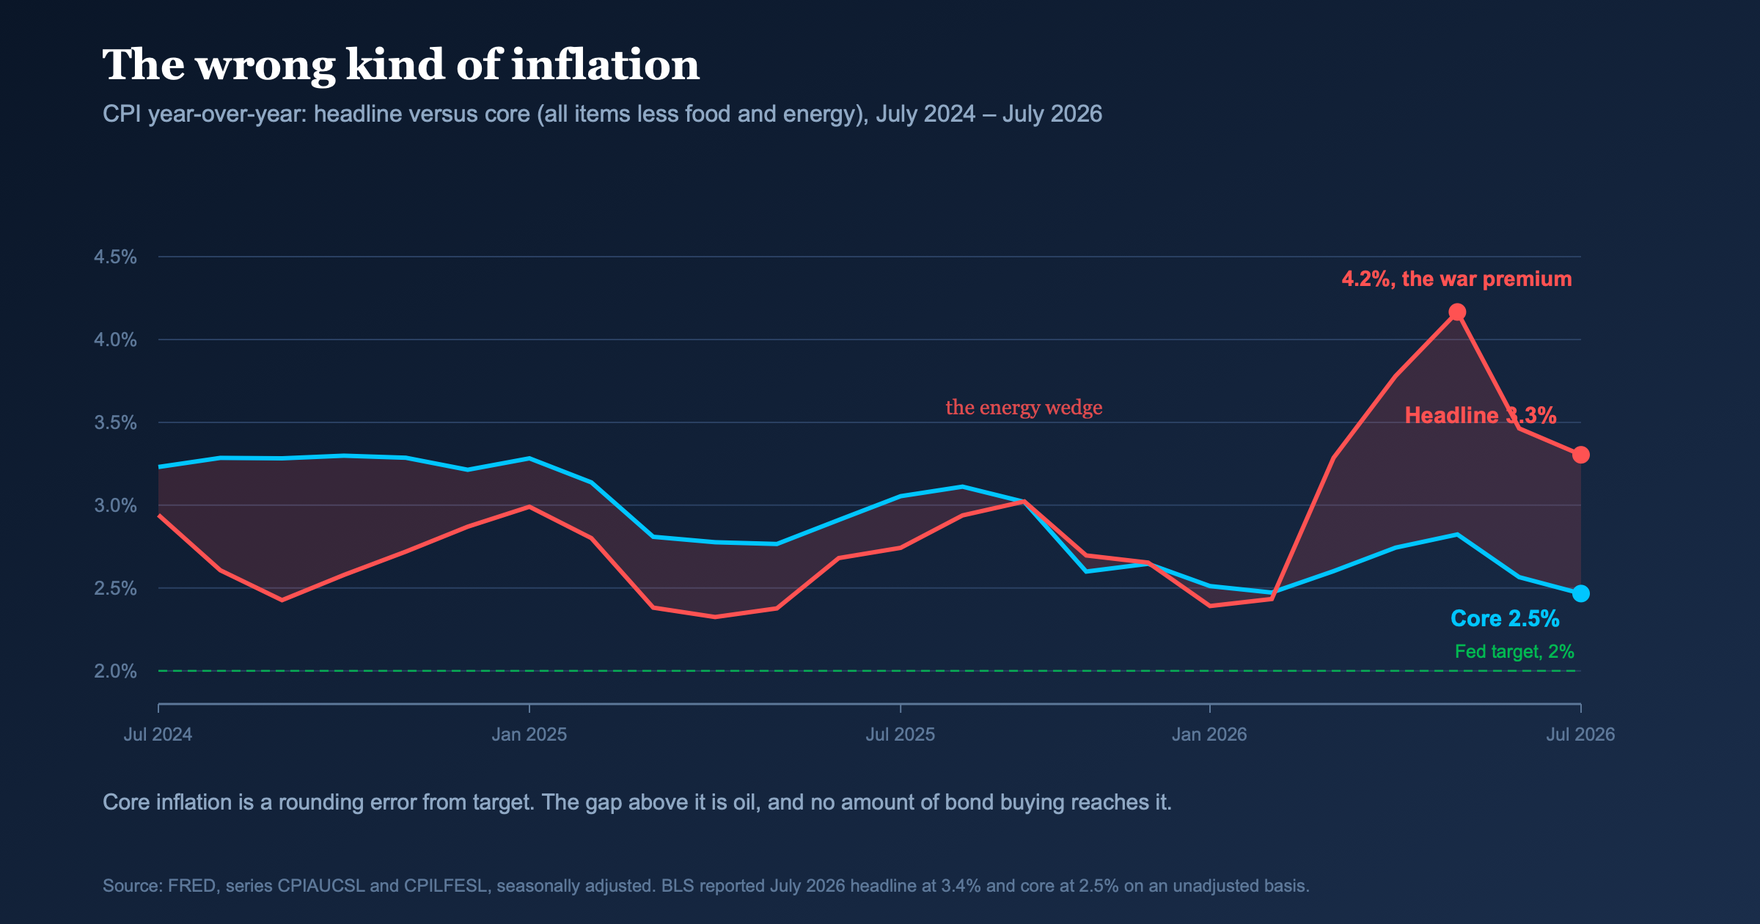
July CPI came in at 3.4% headline and 2.5% core (CNBC). Read those two numbers next to each other, because together they say something the headline alone does not.
Core is basically at target, at least on the left side of the decimal as Fed Chair Warsh likes to say. What’s keeping headline at 3.4% is energy, a spike that peaked above 4% during the war and is decaying, but decaying into a market where the SPR now has to be refilled from a 43-year low, and where the Strait of Hormuz question is not settled.
There is no bond buyback in the world that reaches a barrel of crude.
The second source of goods-side pressure is the one nobody wants to call inflationary because it looks like growth. The AI buildout is a physical, supply-constrained demand shock for transformers, turbines, copper, switchgear, electricians and electricity. Estimates for hyperscaler capex in 2026 run from $670 billion (Goldman Sachs) to $770 billion (Chase), which on either number is on the order of their entire operating cash flow.
That capex is also why the earnings picture looks so much better than the economy feels, and the decomposition is the part worth sitting with, because what is holding up earnings is the same thing holding up the inflation print.
Goldman’s equity strategy team put a number on it in June. Of the roughly 24% earnings growth they expect from the S&P 500 this year, about half traces directly to AI infrastructure spending (Goldman Sachs). Take their own two figures at face value and the index without the buildout is growing at something closer to 12%, which is a perfectly respectable number attached to a completely different economy than the headline describes.
The quarter just reported has the same shape. The two largest contributors to S&P 500 earnings growth were Micron and NVIDIA, and removing only those two names cuts index growth by roughly a third (FactSet). The rest of the top five is Chevron, Exxon Mobil and Broadcom. Look at where estimates moved between March and June and you get the same answer from a different direction: Energy EPS estimates rose 61.5% on WTI averaging $92.55 a barrel against $63.68 a year earlier, Technology rose 8.7% on AI infrastructure, Health Care fell 15.3%, and nearly all of the upward revision to the entire index came from those two sectors (RCK Analytics).
One caveat on the headline, because it is doing work it hasn’t earned. Reported blended growth ran above 50% for the quarter, but that includes very large GAAP mark-to-market gains on equity investments: a $98 billion swing at Alphabet and $53.4 billion at Amazon, the latter mostly from its Anthropic stake. Excluding those two, FactSet had growth at 28.8% (FactSet). None of that is operations, and anyone quoting the fifty-handle number at you is quoting an accounting entry.
So the two forces propping up reported earnings are a datacenter buildout that consumes physical goods and a barrel of oil. Those are not the marks of a diversified economy having a good quarter. They are two supply-constrained impulses showing up on both sides of the ledger at once, in the earnings line and in the CPI print, and that is why the Fed can neither treat this as demand to lean against nor as inflation it can wait out.
The mechanism of this is worth re-stating, because it explains an apparent contradiction a lot of people are getting stuck on. One company’s capex is another company’s revenue. The hyperscaler writes the check; the chipmaker, the equipment maker and the utility book the sale. It shows up in GDP and it shows up in EPS. What it doesn’t show up in is long term payrolls, because a finished data center employs a few dozen people. Roaring earnings alongside a dead labor market isn’t a contradiction, it’s what capex-led growth looks like.
Which takes us to the last leg.
The labor market cannot take the baton
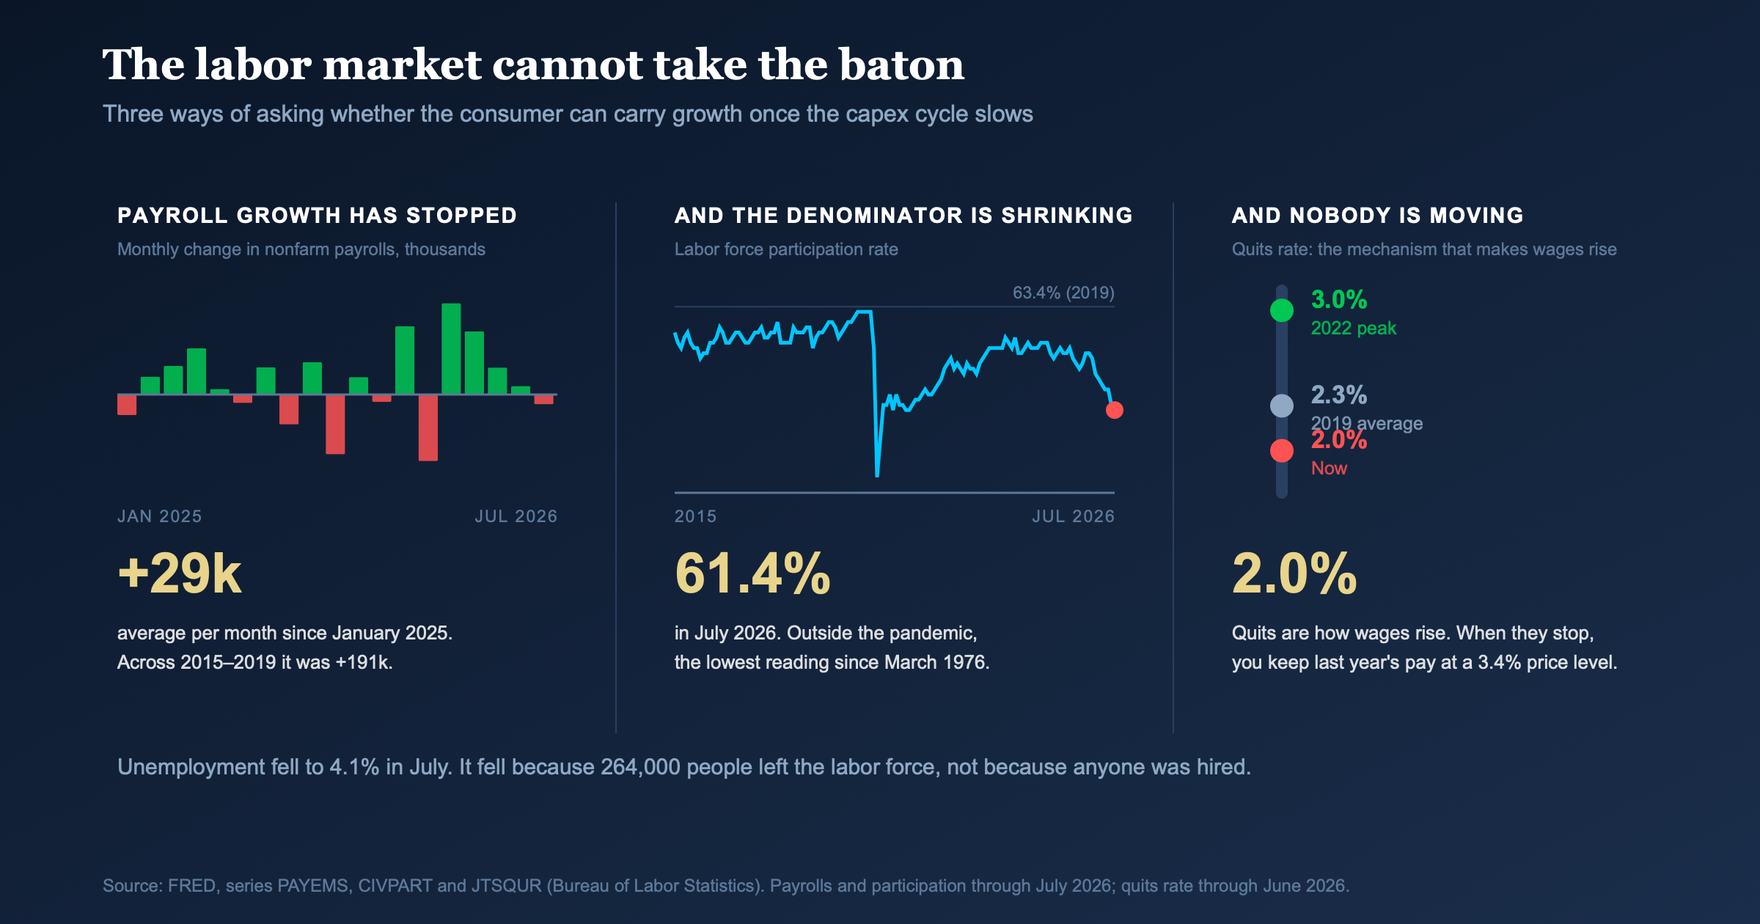
July payrolls fell 23,000 against a consensus looking for +83,000, with May revised down by 66,000. The unemployment rate fell to 4.1%, and it fell because 264,000 people left the labor force. Participation dropped to 61.4%, which outside the pandemic is the lowest since 1976 (CNBC, NBC News).
Payroll growth has averaged about 29,000 a month since January 2025. The 2015–2019 average was 191,000.
But the number I care most about is the quits rate, sitting at 2.0% against a 2019 average of 2.3% and a 2022 peak of 3.0%. Quits are the mechanism by which wages rise. You leave for 15% more, your old seat gets bid up to fill it, and the whole wage curve lifts. When quits die, nobody gets fired and nobody moves. You keep last year’s pay against a 3.4% price level, which is a real wage cut wearing a healthy headline.
So the handoff everybody is counting on, where capex cools or at least stabilizes and stops putting pressure on inflation, the Fed cuts, housing and small business re-lever and hiring resumes, requires a labor market with mobility in it. We do not have one. And the cuts, when they come, arrive into a credit cycle that is already turning. Commercial mortgage delinquencies rose to 4.02% in Q1 2026, and the Trepp CMBS delinquency rate hit 7.55% in March.
Cuts don’t fix a default cycle. They just make funding cheaper for whoever survives it.
Moral hazard, and why a systematic shop cares
I promised at the top that I’d come back to moral hazard and market trust, because I know how that objection lands. Isn’t this reassuring? Isn’t it good that the Treasury is on top of the problem?
The template for why I don’t think so is recent enough that we all lived through it.
In March 2023, after SVB, the Fed stood up the Bank Term Funding Program. Banks pledged Treasuries and agency MBS and borrowed against them at par, not at market value. A bond bought at 100 and worth 82 after the 2022 rate move borrowed like 100. No haircut. One-year term. The facility peaked around $165 billion and closed in March 2024.
That program gets overstated in both directions, so here is what it was and wasn’t. It was not debt monetization. The Fed took the bonds as collateral rather than as purchases, the banks kept them on the books and paid the cash back. It also did not produce consumer inflation. M2 was contracting through 2023, the first sustained decline since the 1930s, and lending standards were the tightest since 2020. By late 2023 the facility’s rate had fallen below what banks earned parking cash at the Fed, so some of them borrowed at par and redeposited for the spread until the Fed repriced it in January 2024 to kill the arbitrage.
So it wasn’t a money printer. What it was is the government deciding that a class of institutions would not have to recognize a loss they had already taken. The subsidy was in the valuation. And the lesson it taught every bank treasurer in America is still on the books, uncollected: mismanage duration badly enough and your losses will be priced at par.
That’s what moral hazard means. Not that something inflationary happened, but that the price of a mistake was waived and the next person is watching.
Now apply the same lens to this morning. When Treasury becomes a discretionary buyer of its own long-dated paper, sized at its own discretion, in a window it chooses, the 30-year yield stops being a clean read on what the market thinks about fiscal risk. The term premium is supposed to be the market’s price on exactly that question. If the issuer is bidding for its own paper to move that number, the number is no longer answering the question.
You can see the pattern once you look for it. BTFP obscured the duration loss. The FX line obscures the carry unwind. The buybacks obscure the term premium. Each one buys real time, and each one removes an instrument from the panel.
That is where this stops being a philosophical complaint and becomes an operational one for a shop like ours. We do not trade opinions, we trade prices, and prices are the input our systems are built on. A managed price is a corrupted input. Every model I have built that reads the long end as a signal about growth, inflation or risk appetite is now reading a number with a policy hand on it, and the hand comes and goes on a schedule set by somebody whose objective function looks nothing like ours.
None of which means you throw the signal out. It means you widen your uncertainty around it, you weight the instruments nobody is managing more heavily, and you get extremely interested in the second derivative: not the level of the intervention, but the interval between them. That is measurable, and right now it is the most informative series I know of that nobody publishes.
The correlation, and why we keep writing about it
We have covered this in the investor letters more than once over the past year, and this morning is a good occasion to put it in front of a wider audience, because the buyback announcement is more evidence for the same point.
For most of the last decade, Treasuries did the job the textbook assigns them. Equities sold off, bonds rallied, the portfolio breathed. That relationship is measurable, and our systems measure it, because correlation isn’t a philosophical position, it’s an input that changes how much risk a strategy is willing to carry.
That relationship is gone, and it has been gone for a while.
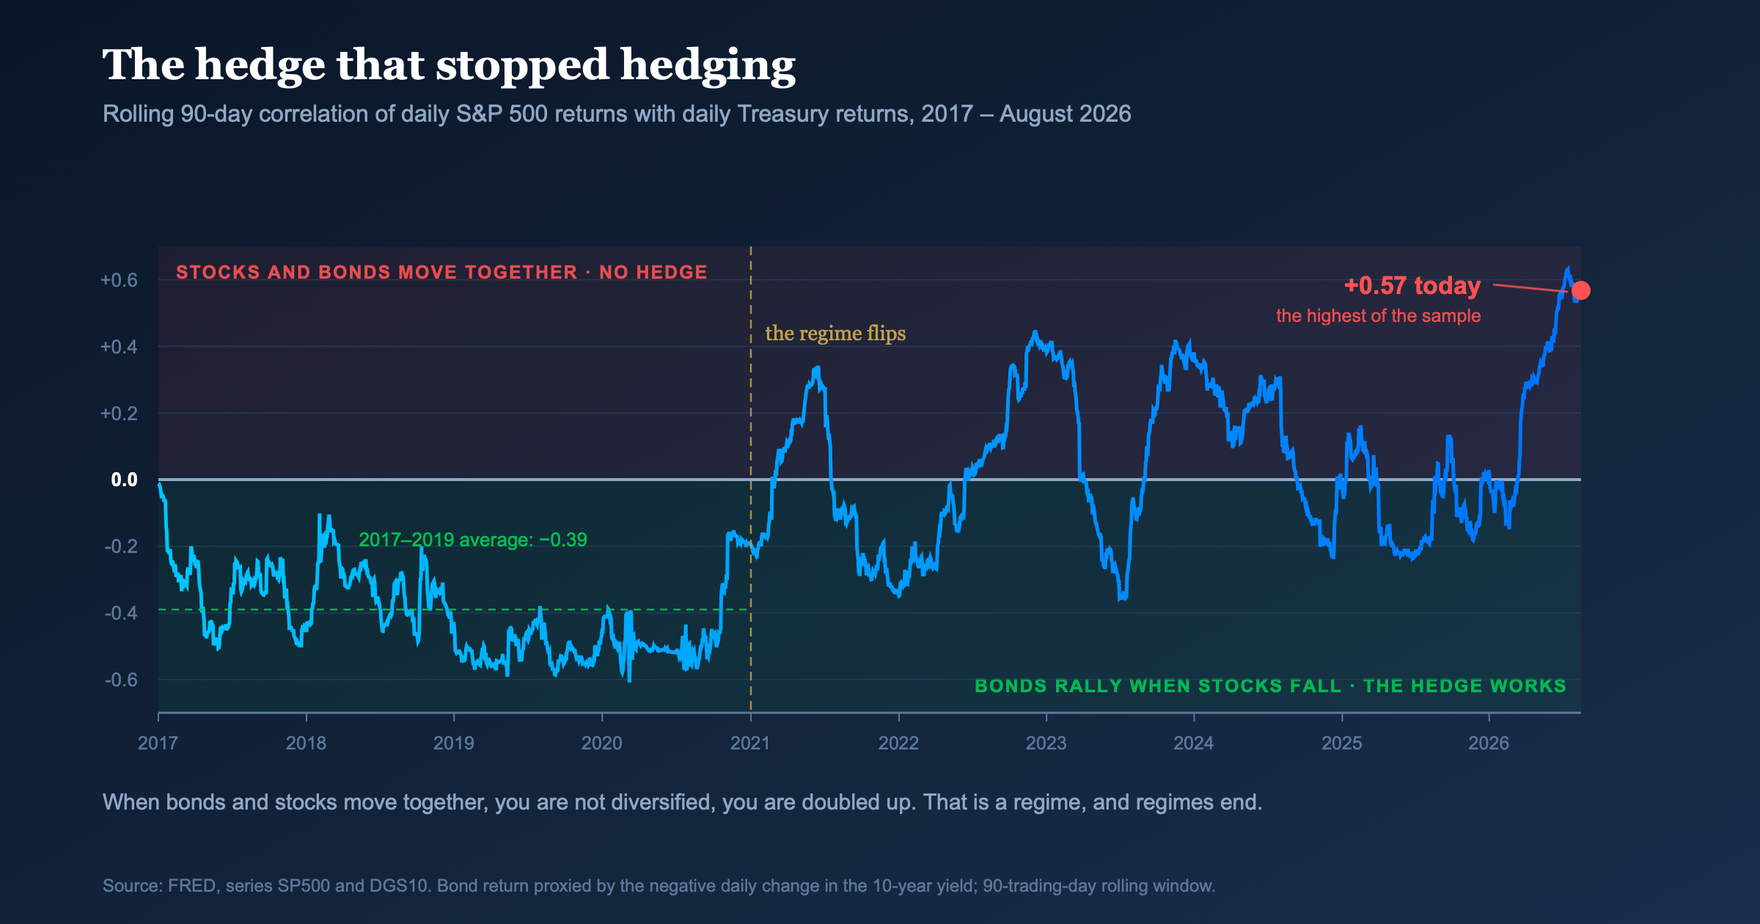
Across 2017–2019, the rolling correlation between daily equity returns and daily Treasury returns averaged −0.39, which is a hedge doing its job. Somewhere in 2021 the sign flipped. 2022 confirmed it, the worst year for 60/40 in a century with both legs down together, and it has not properly gone back. As of this week the reading is +0.57, the highest in the sample.
Positive correlation is the signature of an inflation-and-fiscal-credibility regime rather than a growth regime. When the shock is demand, bonds and stocks disagree and you get a hedge. When the shock is inflation or the government’s own credibility, they agree, and you own two versions of the same trade.
Here is where that shows up in a portfolio, and it is worth being concrete about because it is the practical consequence of everything above.
Our systems read that correlation and it keeps them on the defensive side of neutral. Rising yields alongside a positive stock-bond correlation is historically a regime where drawdowns arrive together and diversification does not save you, so the framework carries less risk into it than a purely price-following approach would. Equities kept climbing anyway. The tape rallied into higher yields on the back of an AI capex cycle that doesn’t much care about the discount rate applied to it.
The result over the last quarter or so for the fund has been a slower stretch of relative under-performance vs the index, worth keeping in context since it is a soft patch inside a strategy that is still ahead of its benchmark this year and ahead since inception, which is roughly what a defensive posture is supposed to look like in a melt-up: you give up some of the top and you keep the shape of the payoff intact.
What I will not do however is call that a broken signal. The correlation read is identifying an unstable regime correctly. What it cannot do, and was never built to do, is tell you how long equities will keep paying inside that regime. Those are different questions, and a framework that conflated them would be worse, not better.
Which takes us to the part that matters for what happens next.
Whichever way yields eventually come down, the hedge comes back.
There are only two paths from here that get the long end meaningfully lower and hold it there:
Inflation is beaten and the economy survives it. Disinflation for the right reason, with supply normalizing, energy behaving and productivity showing up. Yields fall, the inflation risk premium comes out, and the stock-bond correlation reverts toward its historical negative because the dominant shock is no longer a price shock.
Something breaks and the Fed sprints to catch up. Disinflation for the wrong reason, with demand rolling over, the credit cycle biting and the Fed cutting into weakness. Yields fall hard, and bonds do the classic thing: they rally into an equity drawdown, which is the hedge working by definition.
I am not neutral about which of those I think is more likely. This piece has spent several thousand words explaining why I have trouble seeing the first one arrive cleanly with an SPR floor under crude, a goods impulse from the AI buildout, and Hormuz unsettled. But here is the useful part: for the purpose of the systematic framework, I don’t have to pick. Both roads restore the signal value of duration. Both take the correlation back toward negative. Both make Treasuries a diversifier again instead of a leveraged expression of the same macro bet the equity sleeve is already making.
That is an unusual setup, and it is why I am more constructive on the role of Treasuries in a portfolio than I am on the level of the 30-year. The role is close to being restored on either path. The level only works on one of them.
It is also why this morning’s announcement matters more to me as a signal than as a trade. An issuer that has to manage its own long end is telling you the fiscal-credibility premium is live, which is the exact ingredient keeping the correlation positive. In that narrow sense the interventions are self-defeating. Every one of them is evidence for the regime that broke the hedge in the first place.
So what do I do with a 5% thirty-year?
Back to my partner’s original text, and I’ll give the same answer I gave him, just with the work shown.
A 5% 30-year is not a valuation call. It is a regime bet.
You are not buying it because 5% is cheap against history, since history had a different fiscal path, a different bill share and a different politics. You are buying it because you think the next big move in this economy is a growth shock rather than an inflation shock. Duration pays handsomely in the first and gets torched in the second. That is the entire fork, and every other argument about it is decoration.
Two things follow from stating it that way, and both of them are uncomfortable.
The first is that yields falling for the wrong reasons is the bull case for the bond. Bonds don’t care why the economy broke, they care that it broke. So the part of this analysis that makes me most uneasy about the macro, meaning a labor market with no mobility, a growth engine concentrated in one capex cycle and a credit cycle already turning, is the part that pays the coupon holder. I can’t see how yields come down for a good reason, which may be exactly the argument for owning them.
The second follows from the correlation section above, and it’s the sentence I’d put in bold for any client: “Treasuries are acting like a hedge again” is not an independent argument for owning them. It is this same thesis restated. The hedge property and the total return are driven by the same variable, so you cannot count them as two reasons.
On sizing, at 5% you are being paid to wait, which is the cushion buyers at 1.5% in 2021 did not have. Carry is real. But 30-year duration is roughly 17, so a 100 basis point move against you is about a 15% mark-to-market. Size it so you can survive being early, because “right eventually” and “right on schedule” are not the same trade.
And here is the risk to my own view, which I’d rather state than have someone come back to me later asking me what happened. The thing that kills long duration is not the Fed. It’s term premium, meaning supply plus credibility. Treasury doubling its buybacks is, read correctly, an admission that they know it. If the fix stops working, you get the ugly scenario where the long end sells off while the economy weakens. That is the one path where you are right about everything in this piece and still lose money on the bond.
What I’m watching
Not levels. Levels are what everybody argues about on television and they tell you almost nothing here.
September 9. The first upscaled operation. Then count the weeks the 30-year holds under 5.2%, and ask whether it’s holding on real demand or only because Treasury is the bid.
The interval. How long each intervention buys before the next one is needed. Fourteen months in 2023. About a fortnight for the yen this month. When a fix arrives before the previous one has finished working, the game has changed.
SOFR minus IORB, and the RRP balance. This is where the bill flood shows up first, and it shows up well before any headline does.
The quits rate, not the unemployment rate. Mobility is the consumer. U-3 is currently falling for the worst possible reason.
Data center capex guidance, not capex spend. Spend is committed eighteen months out and will look fine right up until it doesn’t. Guidance is where the crack appears first.
November 4. When this window expires, the day after the midterms.
I said at the top that I had reservations about Treasuries at these levels so long as inflation runs above target, deficits stay uncontrolled and oil stays elevated, and that I wanted to see rates come down for the right reasons before getting bullish. Nothing this morning changed any of those three conditions. What changed is that the issuer has now told us, at size and in public, that it cannot tolerate a 5%-plus 30-year, not that it may be able to do anything about that in the long run as history has shown us.
That is useful information. It just isn’t the information the announcement was likely meant to convey.
Blackworks Capital LLC manages funds through Blackworks Capital Management LLC, an Exempt Reporting Adviser. Nothing here is an offer or solicitation or investment advice. Past performance does not guarantee future results.